The Good Old Days Are Back… Only Better
Commentary from Chris Manley, President of Graphco:
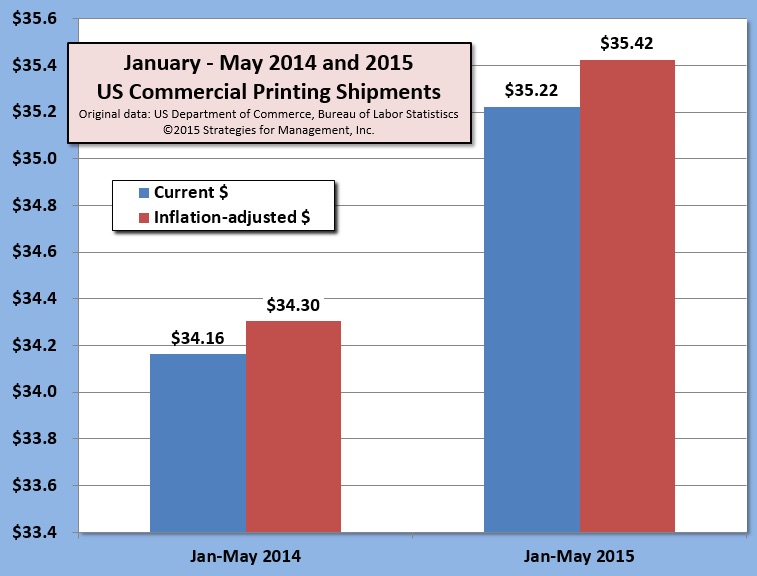
May 2015 US commercial printing shipments were +2.3% higher than 2014, at $7.33 billion in current dollars. This was an increase of $168 million. Because inflation is negative for May compared to last year, the inflation-adjusted increase is +2.7%, or +$194 million. April 2015 shipments were revised down slightly from $7.445 billion to $7.399 billion.
The chart shows the shipments for January through May for 2014 and 2015 (click chart to enlarge). Shipments are about +$1 billion more than 2014.
The last 12 months total $84.8 billion, running +2.3% on an inflation-adjusted basis compared to the prior 12 months. This measure, which we use to annualize the data and reduce stray monthly variations, has been positive for the last four months, The last 12 months have all had positive comparisons to the prior year, averaging a +3.2% increase. On an inflation-adjusted basis, 11 of the last 12 months have been positive, averaging +2.3%. The last extended string of positive months on a current dollar basis was January 2006 through November 2007, a 23 month period, with average growth of +3.2%. Inflation was higher at that time, and 9 of those 23 months were negative on that basis, and the period averaged only +0.2% taking that into account. That meant the growth of that time was essentially an illusion created by inflation.
This latest growth, however, has been a tangible and real bounce off a bad year. While shipments remain below 2013 levels, this new stability is refreshing, if not encouraging. Business owners need to keep in mind, however, as we have advised in the past, that these periods of stability are breathing room to sharpen operations and implement strategies that are appropriate for the years ahead. There is no “business as usual” among our high tech competitors.
You can also read this full article at WhatTheyThink.com